Real-time transmission ratings are essential to help close the gap between data-center demand and grid buildout.
Power
power
Energy & Electricity
energy-electricity
8 min. read


Key takeaways
Power demand is outrunning buildout. Meeting large load growth requires more than new generation; it requires faster interconnection and congestion relief on existing transmission lines.
Dynamic line rating (DLR) is available today, deploys in months, and enables faster speed-to-power. On the right thermally congested lines, DLR can unlock more capacity at a fraction of new infrastructure cost. In one utility demonstration, 5% to 10% of additional capacity was enough to clear most of the congestion on the lines studied.
DLR has been held back by weak incentives, but that is changing. Utilities earn a regulated return on capital they invest in new assets, which favors building new infrastructure over lower-cost solutions like DLR. Load growth and new Federal Energy Regulatory Commission (FERC) mandates are starting to shift the calculus.
The grid cannot expand fast enough for AI demand, but it can carry more
Power demand is booming as data centers scale across the US grid, and current grid infrastructure cannot supply it. This constraint is physical, not financial. Meeting this demand requires a significant amount of power generation and infrastructure upgrades. More than 2 terawatts of generation and storage sit in interconnection queues, roughly 1.5x the total installed generation capacity in the US.
Regional markets are working to accelerate generation buildouts, but connecting that generation to the transmission network remains expensive and slow to match speed-to-power needs. New high-voltage lines take years to permit, cost between $2 million and $6 million per mile to build, and major projects routinely take five to ten years from identification to energization. For example, PJM Interconnection LLC (PJM) identified the Doubs–Goose Creek 500 kilovolt (kV) corridor as a bottleneck feeding Data Center Alley in 2023 and set June 2027 as the date a fix was needed. Dominion Energy's published schedule for its portion of that rebuild anticipates a completion date of 2031.
A number of studies¹𝄒² show there is headroom in the bulk transmission system. Grid-enhancing technologies, such as dynamic line rating (DLR), can convert part of that headroom into capacity today while new generation and transmission are being built. DLR lets suitable transmission lines increase their carrying capacity in real time, unlocking that headroom at a fraction of the cost of a buildout. Realizing that value is a targeting exercise with a key question: On which thermally limited lines can DLR actually relieve congestion?
What is dynamic line rating?
Dynamic line rating is a method for calculating a transmission line's real-time carrying capacity using live weather and conductor-temperature data. It lets grid operators safely carry more power whenever weather conditions allow.
Most transmission lines operate under a static rating: a fixed, conservative limit on current, set for worst-case weather and held all year. The limit is based on temperature, because pushing too much current can overheat the conductor wire. Metal conductors expand as they heat, which can make them sag and touch trees or other obstacles, causing short circuits or fires. Real conditions almost always cool a conductor better than the worst-case assumption a static rating is built on. That means the line can carry more current while staying at the same maximum conductor temperature, and therefore within the same sag and clearance envelope. That headroom is exactly what DLR captures: instead of leaving it on the table, DLR recalculates the line's rating in real time so operators can use the extra capacity safely.
Beyond a static rating is the ambient-adjusted rating (AAR), which many utilities have begun adopting. An AAR recalculates the rating from forecast ambient air temperature, typically hourly and out to several days. DLR goes further, adding wind speed and direction, solar heating, and in some deployments the conductor's measured temperature.
DLR technologies rest on a heat-balance algorithm: how fast a line heats up (from electric current and sunshine) versus how fast it cools off (from wind and cold air). The calculations are standardized in IEEE 738 in North America and CIGRE 601 internationally. The data feeding those calculations can come from line-mounted sensors, weather models, or both, depending on a tradeoff between per-span accuracy and the cost of installing sensors along every span.
Even so, DLR remains limited in the US, and AAR has been slow to arrive. FERC's Order 881 required the transmission providers it regulates to adopt AAR by July 2025, but FERC has granted numerous extensions. PJM became the first to fully implement AAR in March 2026, while Midcontinent Independent System Operator (MISO) and New York Independent System Operator (NYISO) are not expected until 2028.
The near-term value of DLR: Reducing grid congestion
DLR's value is immediate. It can be installed in months, not years, so a currently congested line can start carrying more power the moment conditions allow, reducing congestion right away. When cheaper generation is available upstream of that line, DLR cuts costs directly, because grid operators no longer need to dispatch pricier generation downstream of the congestion to supply load. That means DLR can reduce congestion costs in the current delivery year, compared to a transmission line rebuild that sits in a decade-long queue.
Over a longer horizon, utility planners can build that headroom into long-term capacity models. This is important, because current capacity-expansion and integrated resource plan (IRP) models still run on static or seasonal ratings, and typically leave out the potential gains from grid-enhancing technologies like DLR.
NERC's large loads white paper and FERC's RM26-4 rulemaking both raise the issue of how utilities can absorb multi-hundred-megawatt data center requests without a decade-long transmission build. Solutions like DLR are one of the few tools that can compress that timeline.
The hardware itself is cheap: sensors and data management cost a small fraction of any physical upgrade. That means the economics comes down to identifying the lines that benefit most from DLR. This is particularly important because on most US grids, congestion concentrates on a small number of lines that repeatedly reach their limits. On those lines, DLR can cut congestion costs directly and defer costlier upgrades, while its potential on other lines may be far lower. As a result, identifying those high-potential, thermally congested lines is essential.
Proven DLR examples in the industry
Real deployments show DLR can reduce a meaningful share of transmission congestion costs, with extra carrying capacity above the static rating running roughly 5% to 30%, depending on how often that capacity is available. In Oncor's ERCOT demonstration, 5% of additional capacity would have relieved up to 60% of congestion on the target lines, and 10% would have practically eliminated it. PPL Electric in Pennsylvania/PJM reports annual customer savings of $23 million after deploying DLR across its initial three lines. The DLR installation cost about $250,000, against a rebuild alternative that would have cost about $50 million and taken far longer.
The contrast abroad is instructive. Austria's grid operator, APG, recorded about $13 million a year in congestion savings across roughly 15% of its network. While these savings are real, it's important to recognize that these results come from single, well-chosen, badly congested lines.
The UK's National Grid began with a two-year DLR trial on a single 275 kV circuit in 2022, expanded to more than 275 kilometers of its network by 2025, with estimated consumer savings of about $26 million a year. In April 2026, National Grid signed a five-year contract covering 585 kilometers more, with most installations due by 2028 and potential savings of up to $66 million. Each expansion followed measured results from the stage before it.
Where the headroom is: Screening PJM's Data Center Alley
To illustrate the congestion savings from DLR, Carbon Direct screened PJM's five-minute real-time market record for every binding transmission constraint in 2025. For each one, we captured the shadow price, the marginal value of relaxing that constraint.³
Our analysis focused on thermal constraints, and then identified lines that bind frequently, in conditions milder than the worst case their static rating was set for, which is when a conductor's true rating sits above its static assumption. For the lines that we identified, congestion costs were added over the binding hours to set a bound on the savings that could result from DLR. That full amount would not necessarily be realized in practice, because the shadow price values only the next megawatt freed, and relieving one line can shift the constraint to the next. However, it serves as a useful estimate for the scale of savings that could be achieved.
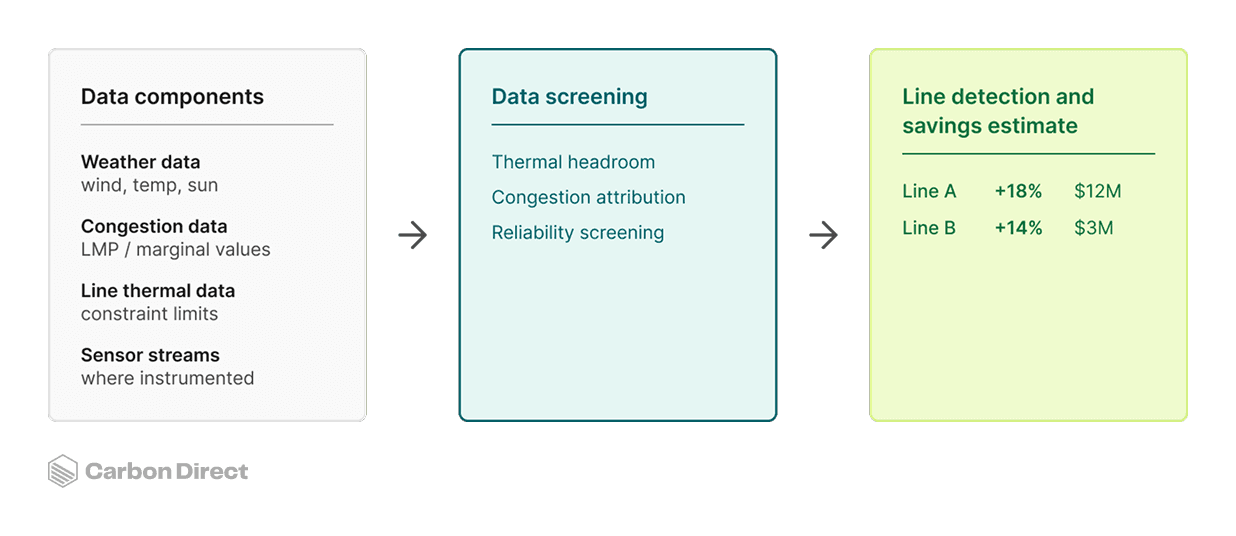
Figure 1. Carbon Direct's screening model combines weather (air temperature, wind speed and direction, cloud cover), congestion, and line-level conductor and rating data into a list of candidate DLR lines with modeled uplift and value (illustrative values shown). Source: Carbon Direct.
We ran the analysis on the Dominion (DOM) zone in PJM, home to Data Center Alley in Loudoun County, Virginia. Figure 2 shows a high-level section of the grid. The 500 kV bulk grid steps down through transformers to the 230 kV substations feeding the data centers, with the lines that experience recurring congestion highlighted. A handful of those 230 kV lines showed up as binding thermal constraints again and again.
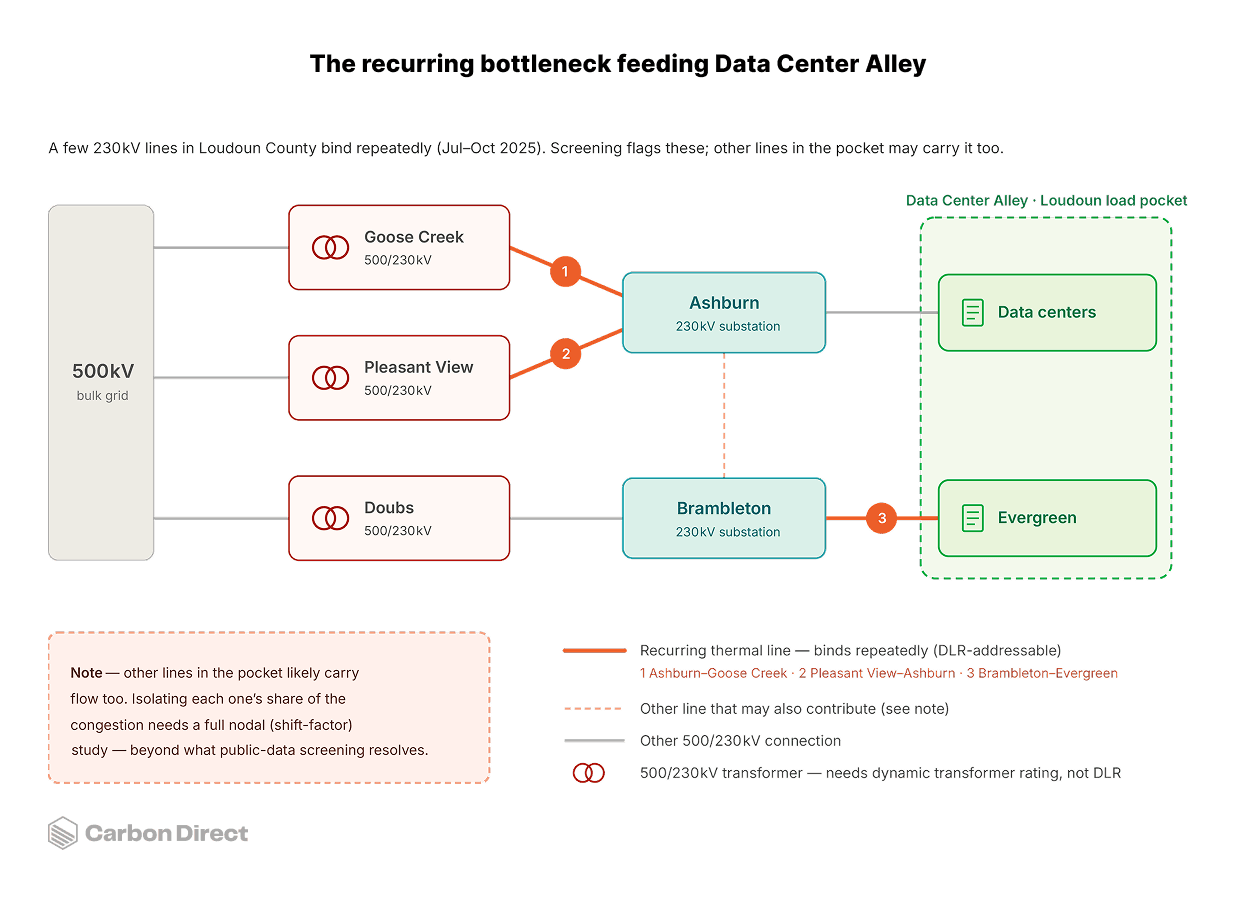
Figure 2. Simplified view of the 500 kV and 230 kV network serving Loudoun County. In red are the 230 kV lines whose thermal constraints were binding repeatedly during 2025. These are the candidates a DLR screen would test. Source: Carbon Direct analysis of PJM data.
The congestion in DOM isn't constant, and it concentrates in particular months and within the day in particular hours. Figure 3 shows three transmission lines within the DOM zone and the number of hours each was thermally congested in each hour-of-day slot over 2025. Binding concentrates in the warm months and, within the day, from late morning through early evening.
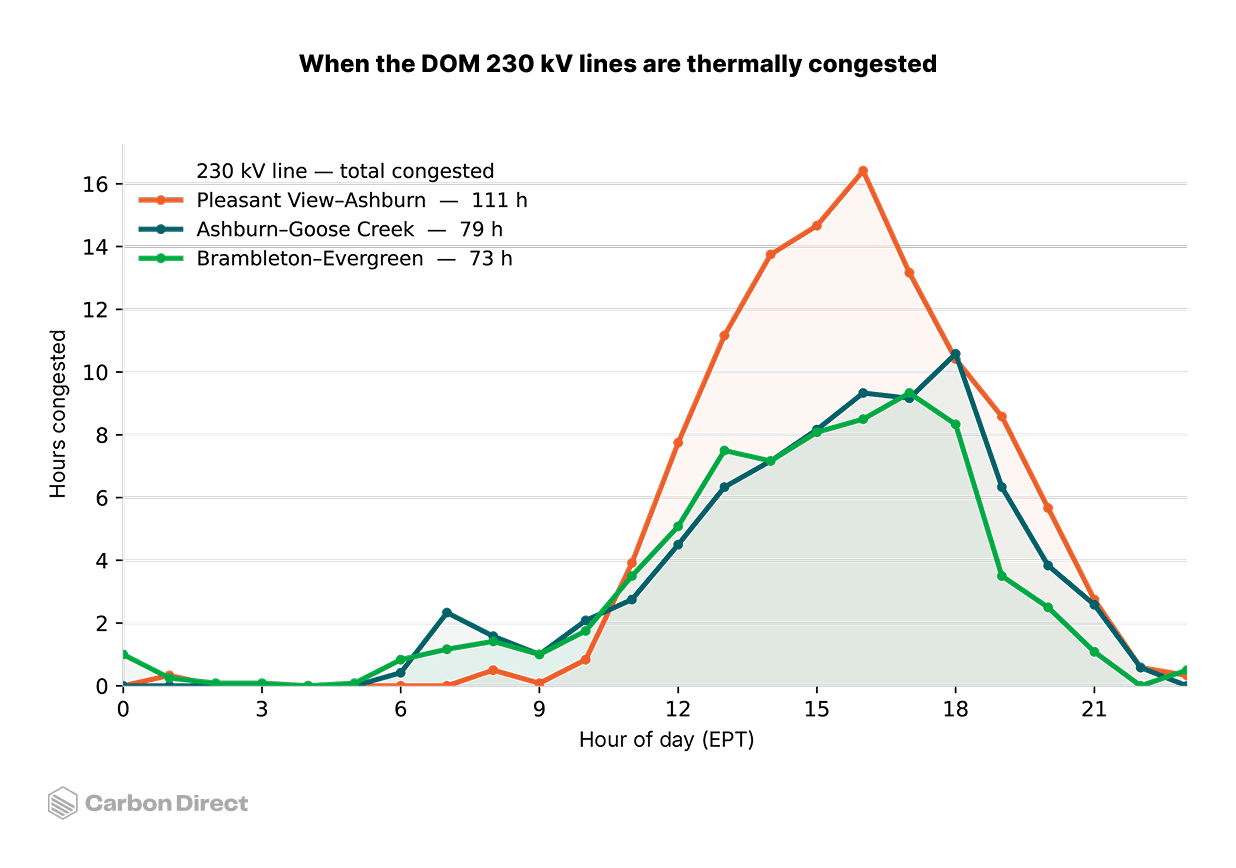
Figure 3. Thermal congestion by hour of day on three DOM 230 kV lines serving data-center load, 2025. Each line shows the total hours that facility was thermally congested in each hour-of-day slot. Across all three lines, ~94% of congested hours coincided with weather that supported a conductor rating increase above a conservative static assumption. Source: Carbon Direct.
At first glance, this period looks like the wrong window for DLR. The local weather record says otherwise. These periods turn out to be some of the windiest hours of the day, not the stillest. Median wind speed at Dulles ran about 3.5 m/s, above the 0.6 m/s crossflow a static rating conventionally assumes, with fewer than 5% of observations falling below that threshold. Median ambient temperature in those hours was about 26°C, against the 35–40°C a static summer rating is typically built for. Across all three lines, the large majority of congested hours coincided with weather that would have supported a materially higher rating.
Valuing just one megawatt of DLR relief at each five-minute shadow price, the estimated savings are worth roughly $300,000 in this three-line example across about 263 line-hours.⁴
Because the value concentrates on a handful of thermally limited, heavily congested lines, and because the operational case has to be made line by line, capturing the opportunity is fundamentally an analytics problem: find the right lines, and prove the savings.
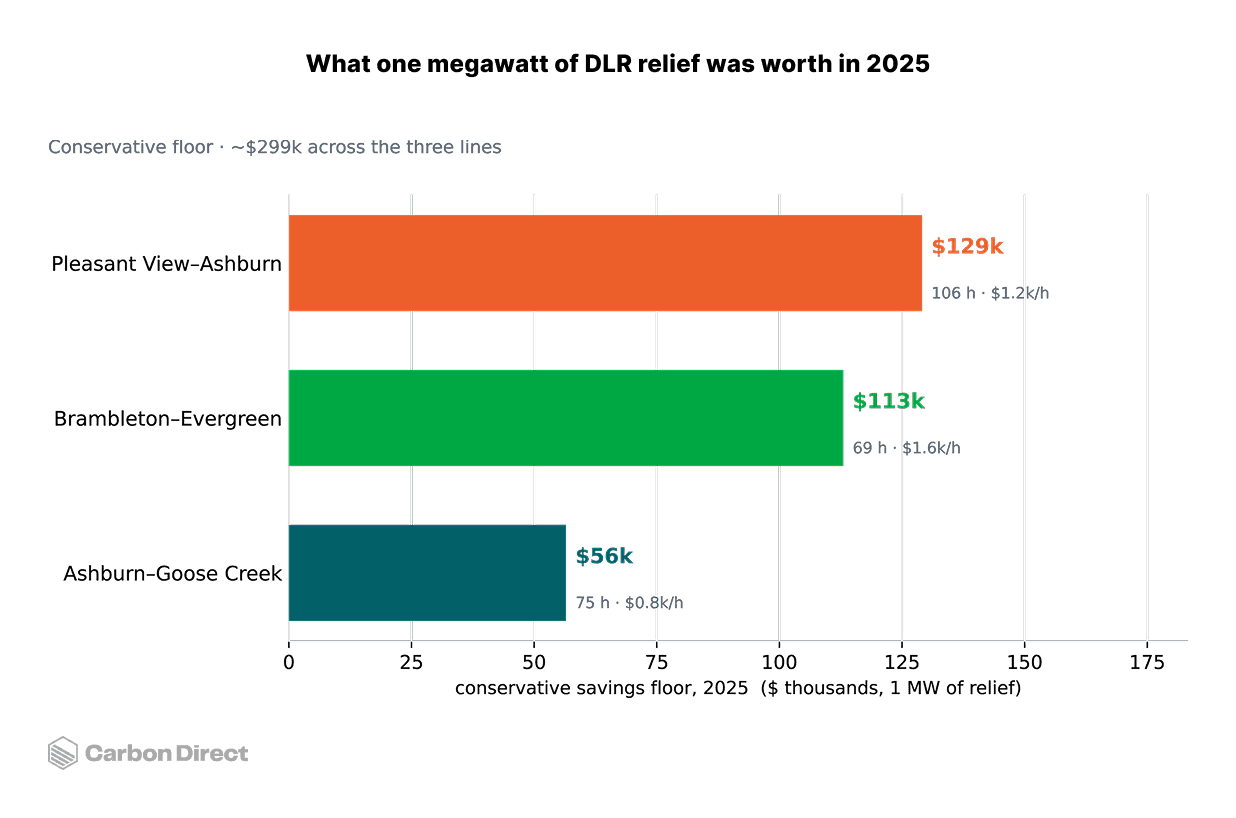
Figure 4. Conservative value of one megawatt of dynamic line rating relief, 2025. For each line, the bar shows the value of 1 MW of relief: PJM's own 5-minute shadow price applied to 1 MW in each binding thermal interval where IEEE 738 was used to indicate available headroom. Figures are gross per line and do not net out congestion that may migrate to adjacent lines. Source: Carbon Direct.
What does it take to scale DLR?
DLR is cheap and effective, but two things stand between it and broader adoption: incentives and advanced grid analytics.
The utility cost-of-service model recovers investment in generation and transmission assets and earns its profit as a regulated return on the capital deployed. Because rates recover capital rather than power delivered, utilities have a stronger incentive to build or upgrade lines than to move more power across the ones they already own. That bias toward capital investment over optimization is why a mature technology has stayed niche in the US for years. Regulators have started to look more closely at this, but the main federal rule still mandates the milder AAR, not DLR, and leaves the return model untouched.
Contingency analysis compounds the problem. Current models are built around fixed line limits. A rating that changes hour to hour adds real modeling work, and more importantly, the system still has to hold under worst-case contingencies. So while operators already forecast weather daily for wind and solar, the harder step is trusting a forecast enough to commit a transmission limit against it. That takes significant predictive analytics built into system planning, not bolted on after.⁵
How policy is starting to shift the calculus
Policy is starting to move the incentive problem. FERC's Order 881 made AAR the minimum for the transmission providers it regulates (effective July 2025, with several operators on extended timelines) and required markets to be capable of accepting dynamic ratings. PJM has started to implement this: PPL Electric has run sensor-based DLR on nine congested lines since 2022, feeding PJM's day-ahead markets.
Order 1920, FERC's first long-term transmission-planning overhaul in more than a decade, now requires planners to formally evaluate grid-enhancing technologies like DLR against conventional builds. It stops short of mandating deployment, but it forces a comparison utilities used to skip. That comparison is now written into filed tariff processes (PJM filed its plan in December 2025). Those first cycles only began in 2026, and the order allows up to three years to reach a selection, so the results are still pending.
A shared-savings incentive, letting a utility keep a slice of the congestion savings it creates, has been proposed to FERC and championed in the Advancing GETs Act, but it isn't yet a rule, so the core misalignment stands. DOE's GRIP program has funded grid-enhancing deployments, and by early 2026, 16 states had some form of advanced transmission technology requirement, with Colorado adding its Grid Optimization Act in April 2026.
The newest pressure is coming from the demand side. Through 2025–26, FERC began overhauling how large loads connect to the grid, and while none of it touches the utility's return on capital, it changes who sees the costs. FERC issued show-cause orders directing all six grid operators to justify or reform their large-load rules. This tees up consideration of alternative transmission technologies in study processes and greater transparency into costs.
And the rules are moving toward making the large load pay for the upgrades its connection requires. Pennsylvania's model large-load tariff, for example, recommends utilities charge data centers for the upgrades their interconnection makes necessary. It also instructs utilities to let those customers self-construct certain upgrades, including some affecting the wider grid. That combination is what matters. The party paying the bill now has a reason to ask whether a cheaper fix exists and, in at least one state, a route to build it. We have not yet seen a DLR deployment selected this way, because these frameworks are only months old, but the cost gap between a DLR fix and a rebuild is becoming visible to the party who pays the difference.
How Carbon Direct helps find the value of DLR
Through our Power, Data, and Innovation practice, Carbon Direct combines transmission congestion data, line-level thermal constraints, and short-term weather forecasts into a single view of where dynamic ratings would actually pay. The output is a short list of candidate lines, each with a modeled capacity uplift and an estimated dollar value, turning a vague “DLR is promising” into a priced, line-by-line decision. It is the transmission-side complement to our work on the interconnection queue and demand-side flexibility. All three are ways of closing the gap between demand and delivered capacity faster than new construction allows.

Prabha, R., Min, L., & Rajagopal, R. (2026). Widespread thermal headroom and localized bottlenecks coexist in the Western Interconnection bulk grid. Research Square (preprint), posted May 29, 2026. https://doi.org/10.21203/rs.3.rs-9316767/v1
United States Department of Energy (June 2019) - Dynamic Line Rating - Report to Congress https://www.energy.gov/sites/prod/files/2019/08/f66/Congressional_DLR_Report_June2019_final_508_0.pdf
The congestion identified here focuses on transmission lines only and predates PJM's move to ambient-adjusted ratings in March 2026.
The $300,000 savings figure is specific to this example and represents the first megawatt of relief. The value of savings can vary by line, time, weather conditions, and the shadow price realized in a specific location on the grid.
A generation forecast error is a quantity error, and reserves exist to cover it. A rating forecast error moves the security limit itself, and there is no reserve product for that.