Power
power
Energy & Electricity
energy-electricity
Carbon Accounting
carbon-accounting
7 min. read


Key takeaways
The Greenhouse Gas (GHG) Protocol’s proposed scope 2 revisions would shift many large power buyers from annual renewable energy certificate (REC) accounting to 24/7 hourly matching and reveal a larger emissions gap than most inventories currently report.
Of all the US grid regions modeled, the emissions gap between annual and 24/7 hourly matching is widest in PJM Interconnection (PJM) and the Electric Reliability Council of Texas (ERCOT), the markets where data center load is growing fastest.
Carbon Direct's modeling quantifies the shift from annual to 24/7 hourly matching: serving a 4-gigawatt (GW) data center load at 100% hourly carbon-free energy requires 9.6 GW of additional clean capacity in ERCOT and 10.5 GW in PJM, a roughly 800-megawatt premium in PJM that translates directly into cost and siting strategy.
Closing that gap requires investments in clean, firm generation technologies, like natural gas with carbon capture and storage (CCS), battery storage, and geothermal. The optimal mix varies by market and load profile, which means modeling current and future emissions positions under 24/7 accounting to understand the best procurement options for a specific portfolio.
Annual REC accounting no longer holds at data center scale
For years, large corporate energy buyers have relied on a straightforward approach: purchase renewable energy certificates (RECs) or sign virtual power purchase agreements (VPPAs) to offset market-based scope 2 emissions. Under the current GHG Protocol guidance, these instruments allow companies to claim low or zero emissions regardless of when or where clean energy is actually generated. When corporate clean energy demand was modest, this fueled new renewable project development while aggregate grid emissions were trending down.
That approach worked, until now. Energy demand from data centers and hyperscalers is surging. The Federal Energy Regulatory Commission (FERC) reported more than 50 GW of data center capacity operating in the US at the end of 2025, much of it concentrated in regions where local clean generation cannot keep pace. When corporate clean energy demand was modest, the gap between contractual claims and physical generation was small enough that few questioned this argument. At hyperscaler levels, with load concentrated in a handful of grids, that gap is becoming too large to ignore.
From a climate perspective, well-designed renewable procurement has created real impact by channeling corporate capital into new clean generation, and reducing CO2 emissions anywhere to benefit the climate everywhere. From a grid perspective, power consumption and generation must balance in real time, and the flow of electricity is constrained by the physics of the transmission system. Some regulators, investors, and standard-setters argue that corporate clean energy claims should be grounded in this second, engineering perspective rather than the first. The GHG Protocol's proposed revisions reflect that view, and would force buyers to defend their claims against it.
Carbon Direct’s modeling of this 24/7 framework in PJM and ERCOT helps quantify its costs and emissions implications in the markets where the stakes are highest.
What does 24/7 hourly matching mean for scope 2 accounting?
The biggest proposed change to the GHG Protocol’s current Scope 2 Guidance is the move from annual power reporting and matching to a 24/7 approach. Instead of calculating emissions with an annual emissions factor (EF) based on their independent system operator (ISO) or eGRID region for each megawatt-hour (MWh) consumed, companies would need to use hourly-specific EFs.
Companies would still be able to retire RECs to reduce their market-based emissions. However, companies would need to show that these RECs came from clean energy that was generated on the same grid, in the same hour as their facilities consumed power. This makes annual, location-agnostic REC retirement, currently the dominant practice, insufficient for 24/7 market-based accounting.
Both the time restriction (hourly matching) and the location restriction (generation on the same grid as consumption) will make it more difficult for companies to retire RECs. For example, because today's methodology is location-agnostic, a New York-based company can retire RECs from a Texas wind farm (purchased unbundled or via a VPPA) to reduce its reported market-based scope 2 value. This has allowed renewable development to follow the best resource sites rather than the load. Similarly, the time of day that the wind farm generates energy is irrelevant, as long as it is approximately in the same calendar year.
Under the proposed revisions, retiring these RECs would no longer be acceptable for the New York company, since they would fail both location- and hourly-matching requirements. As a result, companies with large REC portfolios today may no longer be able to retire them in order to reduce their market-based scope 2 emissions, if the proposed revisions take effect. These companies may face significant unmatched consumption under 24/7 accounting, especially during evening peaks or grid stress events when fossil-based generation fills the gap.
Annual matching vs 24/7 hourly matching | |
|---|---|
Annual matching (current methodology) | 24/7 hourly matching (proposed methodology) |
|
|
The figure below illustrates the gap between what a representative large buyer reports under the current annual location- and market-based methodologies, versus what an hourly 24/7 analysis reveals.
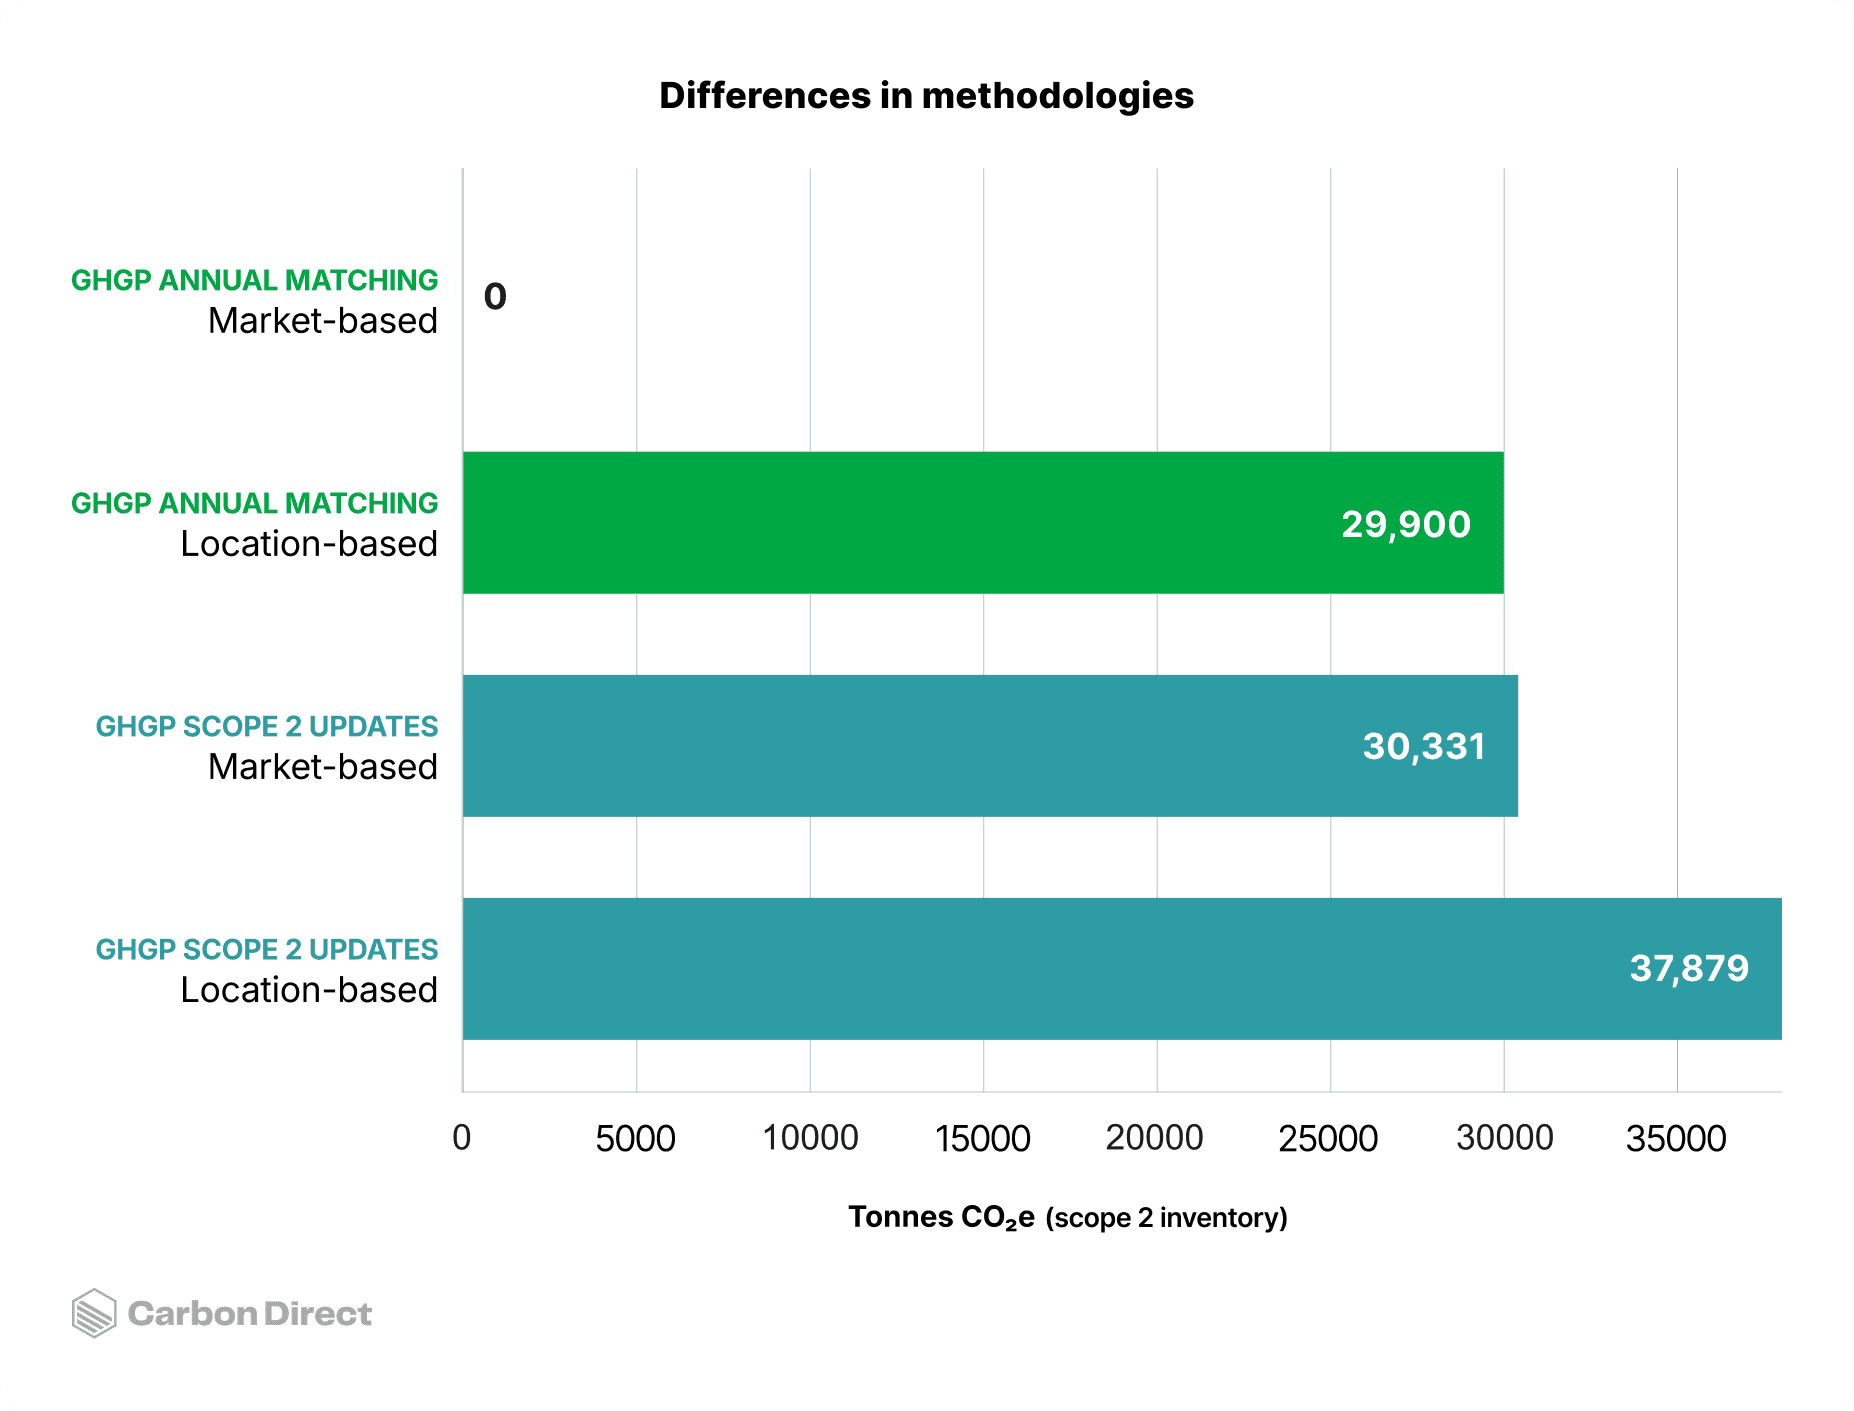
Figure 1. The difference in methodologies for electricity emissions accounting: Annual location- and market-based vs 24/7 hourly matching. The annual matching values use a single eGRID annual emissions intensity for location-based accounting; market-based is zero in this scenario because the modeled solar EACs meet the 100,000 MWh load. The Scope 2 updates use hourly emissions intensity data for the same calculations. Note: this represents a hypothetical entity with a flat, 100,000 MWh annual load and 58 MW of co-located solar capacity in ERCOT.
Understanding this emissions gap is the essential first step for buyers to make informed decisions about which instruments to retain, which contracts to renegotiate, and where new investment will matter most. If the proposed scope 2 revisions are enacted, companies procuring clean energy will be disincentivized from buying RECs sourced from variable renewables in distant locations, and instead will find it more favorable to invest in same-grid clean, firm generation, such as geothermal, nuclear, and renewables plus storage. RECs from these projects would qualify to be retired against market-based scope 2 emissions under the proposed revisions, where today's distant-wind or off-peak-solar RECs would not.
Where pressure is the highest: PJM and ERCOT
Two markets stand out for projected hyperscaler load growth: PJM, which covers the extended mid-Atlantic region, and ERCOT in Texas. Both are on track to absorb massive increases in data center demand over the next decade, and both expose the limits of annual REC accounting in ways that will be hard to ignore under the new proposed framework.
PJM: 60% fossil generation means high marginal emissions
PJM is one of the largest and most complex wholesale electricity markets in the world. Its generation mix still includes 60% coal and natural gas, which means hourly emissions intensity remains high, particularly during evening peaks and grid stress events when fossil generation dominates the dispatch stack.
Buyers relying solely on annual REC retirement may show low market-based scope 2 emissions today, but a 24/7 analysis tells a different story. For PJM-based buyers, this means hourly matching gaps will be largest during evening and overnight hours, when nuclear and storage become disproportionately valuable relative to additional solar.
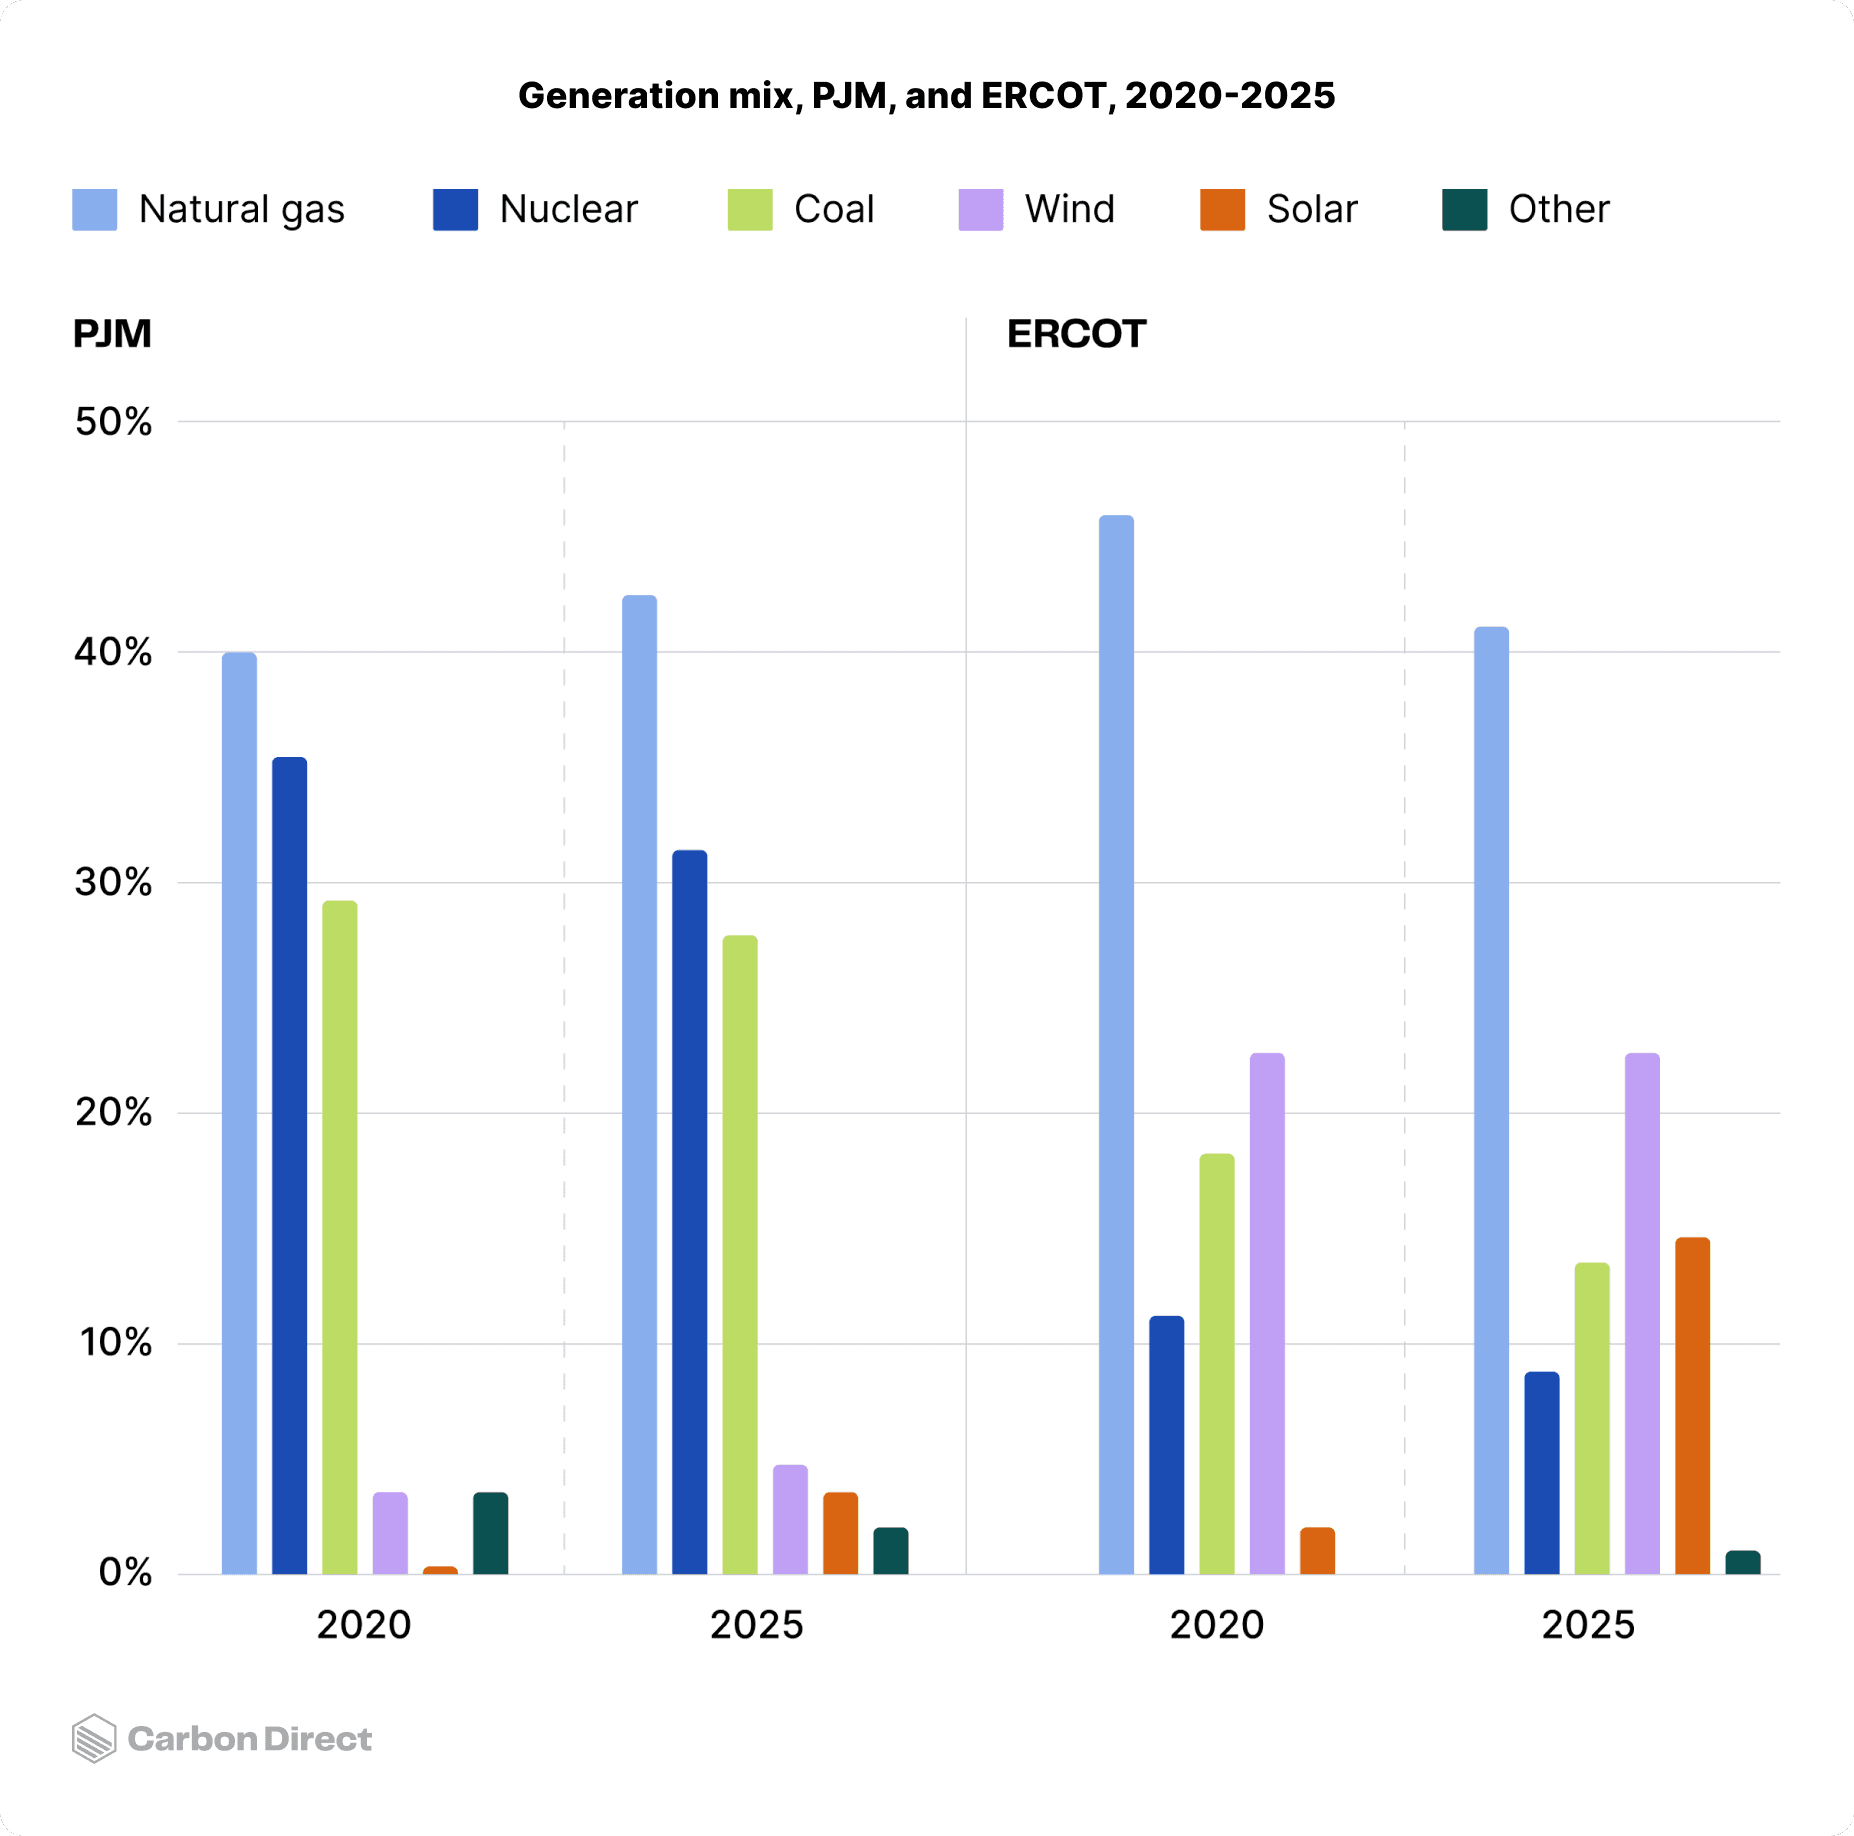
Figure 2. The power generation mix in regional power markets, PJM and ERCOT.
ERCOT: Solar and wind don’t peak when demand does
Texas has abundant wind and solar, with solar generation growing nearly 7x since 2020, but those resources don’t always run when demand peaks. While fossil-based generation has declined since 2020, it still comprises more than half of ERCOT’s generation. Solar dominates midday, wind peaks in the evening, and natural gas fills the gaps, especially during high-demand evenings or extreme weather events.
Buyers with large ERCOT footprints may find that VPPA portfolios, which generate most of their clean energy in off-peak hours, already satisfy the proposed location-based test but fail on hourly matching. Battery storage and demand flexibility could help bridge the gap.
Figure 3 below quantifies that gap in both markets by showcasing the carbon-free energy (CFE) score in ERCOT and PJM, as well as the additional capacity required for a 4 GW load to achieve a 100% CFE target. The CFE score is the share of grid-supplied electricity in a given hour that comes from carbon-free sources, and is the metric the proposed scope 2 revisions would use to evaluate hourly matching. A 100% CFE target means electricity consumption is matched to carbon-free generation in every hour of the year.
In the left panel, a representation¹ of each market's 2030 hours are sorted by grid (CFE) score, from the dirtiest hour on the left to the cleanest on the right. Neither grid approaches 100% carbon-free on its own, and the shaded areas represent the unmatched hours a buyer claiming 100% clean energy through annual instruments would actually carry under 24/7 accounting. The gap is the maximum unmatched hours a buyer might be exposed to, as some RECs procured through annual matching may qualify under the new rules, if satisfying the locational and hourly requirements.
The right panel translates that gap into action. The additional co-located clean generation and storage required to serve a representative 4 GW load (roughly 5% of the forecast 2030 C&I load in ERCOT and 4% in PJM) at a 100% hourly CFE target, on top of what the underlying grid already provides.
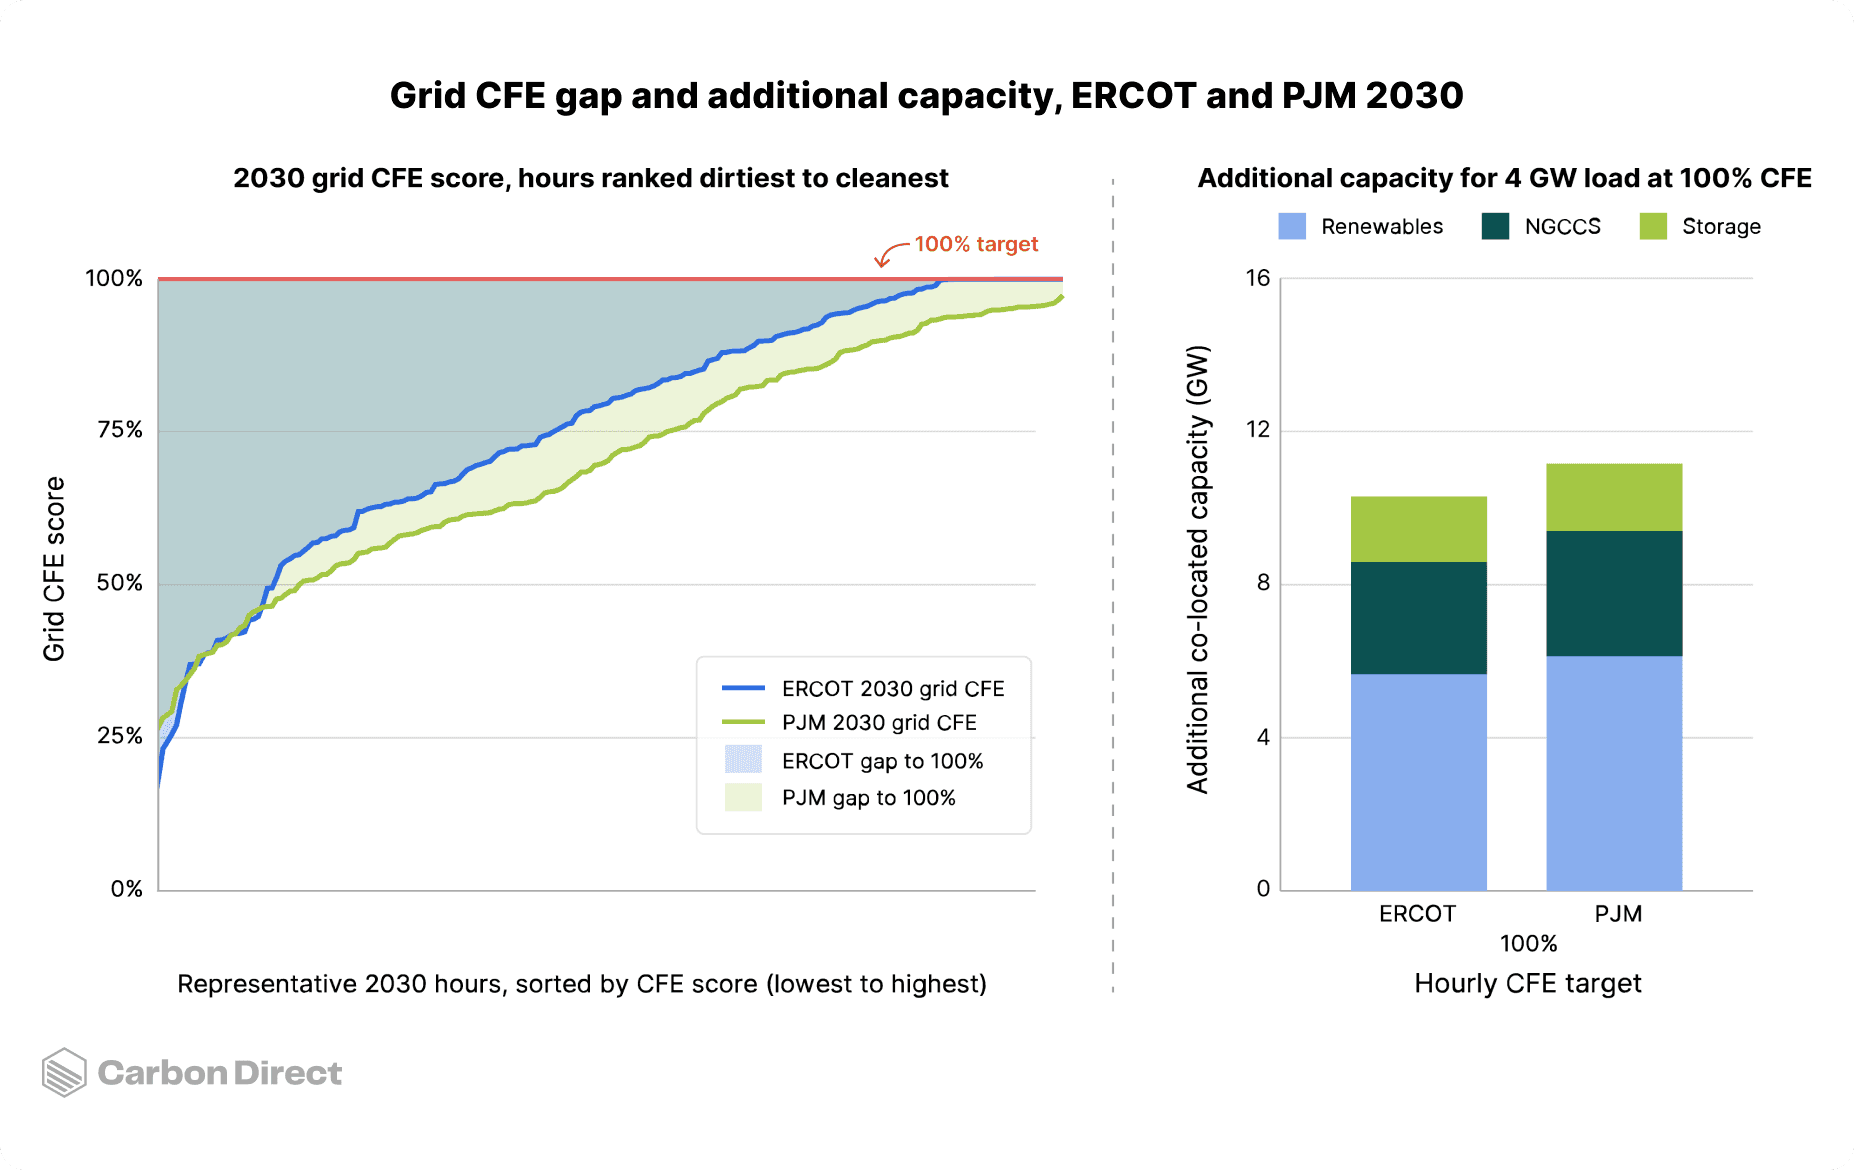
Figure 3. Carbon-free energy (CFE) gap and additional capacity required to meet hypothetical CFE demand. Note: Natural gas with CCS is included in the 100% CFE stack, though it represents a ~95% (rather than fully zero) scope 2 emissions reduction. Modeling assumes technology costs as per the 2024 NLR Annual Technology Baseline-Conservative scenario.
A few patterns are worth highlighting. First, the left panel confirms that PJM’s grid will still spend materially more hours below 100% carbon-free than ERCOT’s in 2030, a direct consequence of the coal- and gas-heavy generation mix described above. Notably, ERCOT's curve reaches 100% in a meaningful share of hours (windows when the grid is running entirely on carbon-free resources), while PJM's never does, meaning some fossil generation is dispatched in every hour.
Second, the ISO a buyer operates in drives a meaningful difference in build-out: hitting 100% hourly CFE for a 4 GW load takes 9.6 GW of additional capacity in ERCOT and closer to 10.5 GW in PJM. This indicates the advantage of achieving hourly and locational matching in already clean grids, which may influence a buyer choosing where to site new workloads.
Renewables have the largest share of the additional capacity in both markets (5-6 GW), paired with significant long-duration energy storage (~2 GW), while natural gas with CCS provides meaningful clean, firm capacity (~3 GW). ERCOT’s storage share of capacity is slightly larger, reflecting the midday-solar/evening-load mismatch, while PJM leans a bit more on natural gas with CCS, where clean, firm generation does more of the heavy lifting due to lower wind speeds and solar irradiance than in Texas.
The right panel also illustrates why clean, firm technologies (natural gas with CCS, advanced nuclear, and enhanced geothermal) are likely to be included alongside renewables and batteries in any serious 24/7 portfolio. With only renewables and batteries, hitting the same target requires about double the total generation and storage capacity. In both markets, targets that look achievable today on an annual REC basis will require materially more capital and a different mix of resources, under 24/7 accounting.
Top questions large power buyers need to model before the rules change
The GHG Protocol revisions are not finalized, and the timing of any mandate remains uncertain, which is exactly why modeling cannot wait.
A useful self-test for any large power buyer is: can your team answer the following today with defensible numbers?
What is your hourly CFE score across your largest load centers, and how far does it sit from your reported market-based emissions?
Which of your existing VPPAs and REC contracts hold value under 24/7 accounting, and which become effectively stranded?
What mix of resources delivers the incremental clean, firm capacity that closes your gap in PJM, ERCOT, or wherever your load is concentrated at the lowest cost?
If your next gigawatt of load were sited in a different ISO, how would your emissions position change?
Clean firm projects do not appear off the shelf. Advanced nuclear, enhanced geothermal, and natural gas with CCS all carry multi-year development timelines, and corporate offtake agreements are often what get these projects financed in the first place. Buyers who engage now help shape the project pipeline that will be available in their target markets in 2030, and can lock in offtake terms before competition for the most valuable sites tightens. Buyers who wait until the methodology is final will be working with shorter lead times, fewer development partners, and less leverage to specify projects that fit their load profiles and hourly matching needs.
Modeling the 24/7 emissions gap with Carbon Direct
For large power buyers assessing what the proposed GHG Protocol revisions mean for their power procurement portfolio, Carbon Direct's Advanced Power Emissions Analysis solution models the gap between current market-based reporting and what 24/7 accounting would reveal—by market, load profile, and technology stack.
To understand what the transition from annual to 24/7 accounting means for a specific portfolio, contact our team.

¹ All 8760 hours in the year were split into 200 contiguous segments; segment splits were determined based on minimizing segment variation across key metrics (e.g. renewables generation, load profile, etc.)


